Have a story idea
Have a story idea? Send it to us here.

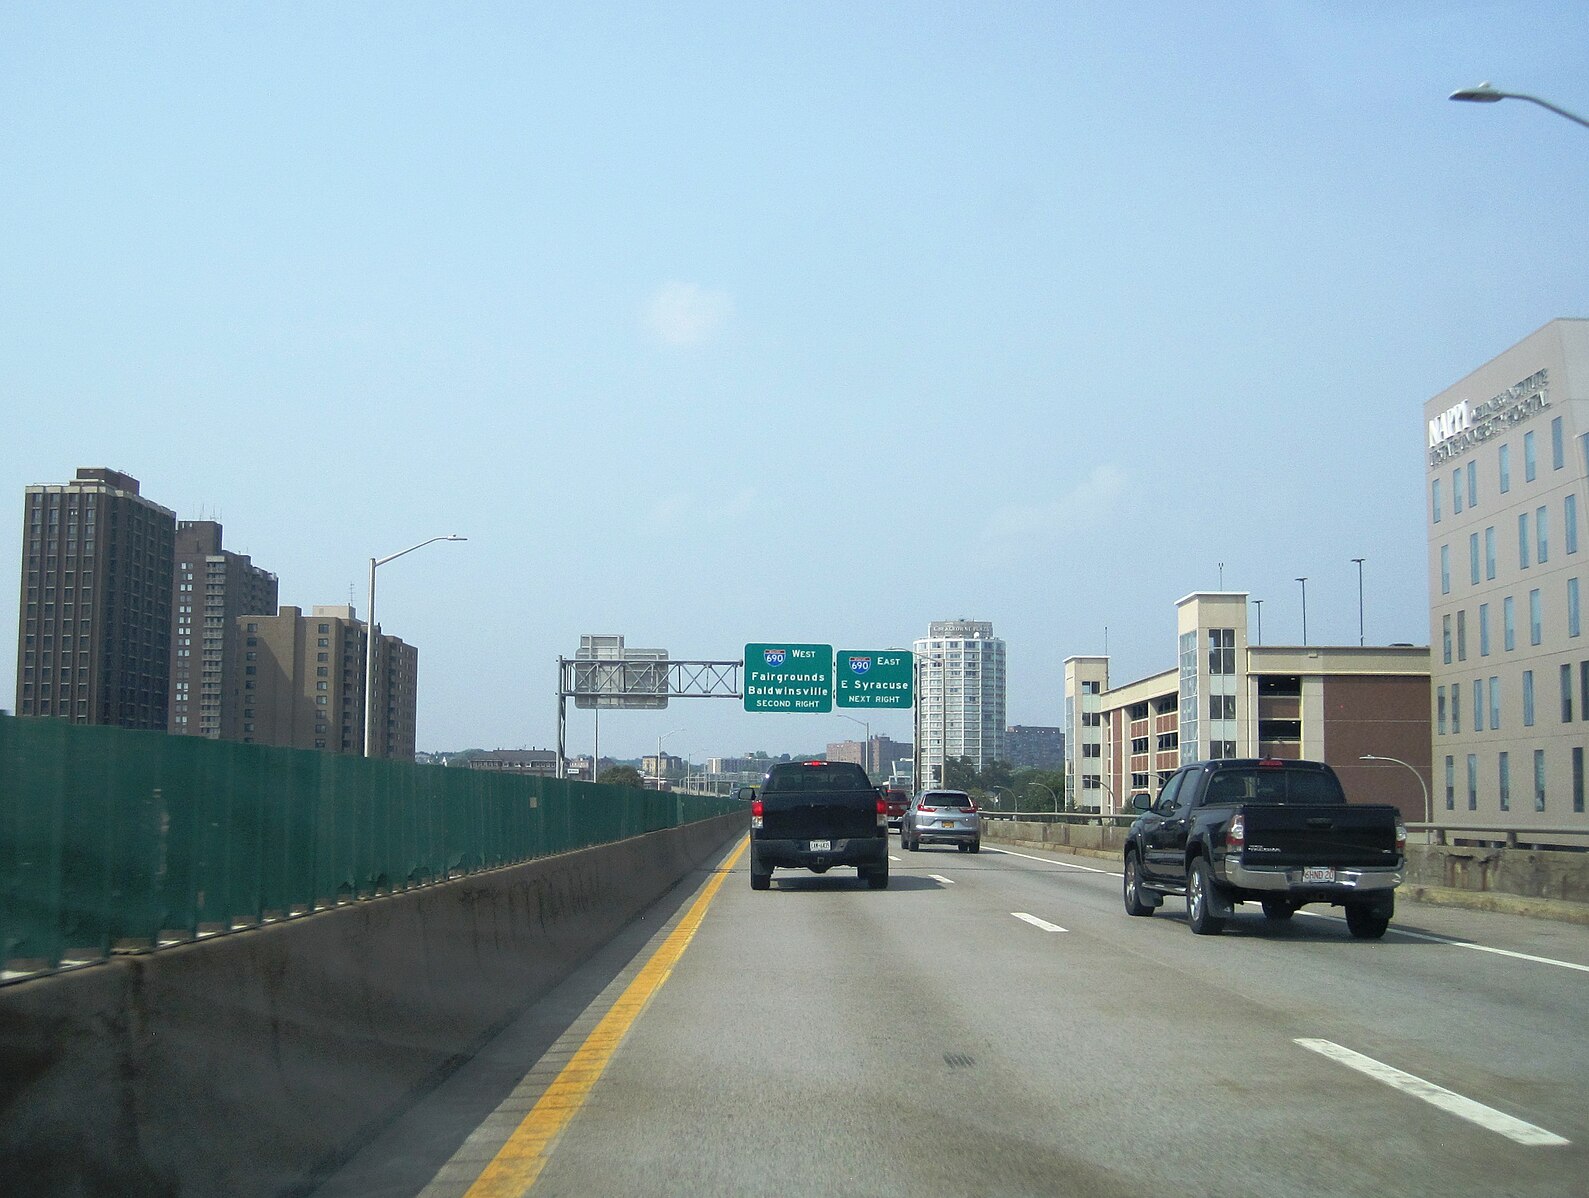
Source : Wikimedia Commons
December 11, 2023
Author : Patty Allen
For the tenth consecutive month, October saw increased construction investment, mostly due to work on public projects financed by the federal and state governments.
According to the data released by the Commerce Department, spending on construction rose by 0.6% in October to an annual rate of over $2 trillion.
The September data was revised downward to show that construction spending increased by 0.2% rather than 0.4% as previously reported. In October, construction spending increased 10.7% year on year.
Private construction spending increased by 0.7%, while residential building investment increased by 1.2% in October. The amount spent on residential construction increased by 1.2% to $884.4 billion, while the amount spent on building non-residential buildings increased by 0.1% to $694.8 billion.
Private construction spending increased by 0.7% in October, reaching an annual rate of $1.579 trillion.
Spending on new single-family home construction increased by 1.1%. In the third quarter, single-family homebuilding helped to end a nine-quarter drop in residential investment.
The lack of previously owned homes on the market drives new buildings, but mortgage rates above 7% pose a barrier for builders and prospective home buyers. Multi-family housing project spending decreased 0.2% in October. This has been due to a considerable supply of multi-family homes and a high rental vacancy rate.
Spending on private non-residential constructions such as factories increased by 0.1%. Production construction spending increased 0.9%, bolstered by the Biden administration's efforts to bring semiconductor production back to the United States.
Public construction spending increased by 0.2%. State and local government spending climbed by 0.1%, while federal government spending increased by 2.2%.
High interest rates have lowered the demand for new houses and apartments, but they have less impact on other construction forms.
During the last 12 months ending in October, the total construction outlays increased by over 11% as compared to the rise of residential investment of 1% during the same period.
The government funding for construction has increased by 16% in the last 12 months to support the construction industry.
The recent success can be attributed to the Biden administration's approval of large subsidies and other incentives.
As per the data from the Commerce Department, public construction spending increased by 0.2% in October to $447.8 billion in annual spending.
Highway construction spending decreased by 0.3% to a rate of $132.0 billion, while spending on educational construction increased by 0.4% to $97.2 billion.
Here is a look at the top 50 Federal Government Construction Firms for 2023:
| S.No. | FIRM | 2022 REVENUE |
| 1 | Fluor | $994,366,165 |
| 2 | BL Harbert Intl. | $786,834,062 |
| 3 | Hensel Phelps | $552,313,651 |
| 4 | Turner Construction | $441,849,718 |
| 5 | Clark Group | $338,440,000 |
| 6 | AFG Group | $312,173,835 |
| 7 | Mortenson | $285,026,000 |
| 8 | McCarthy Holdings | $247,093,615 |
| 9 | Whiting-Turner Contracting Company, The | $236,905,834 |
| 10 | Truebeck Construction | $158,567,745 |
| 11 | Brasfield & Gorrie | $155,003,457 |
| 12 | M.C. Dean | $152,890,472 |
| 13 | JE Dunn Construction | $139,618,240 |
| 14 | HITT Contracting | $109,849,994 |
| 15 | Hill International | $104,681,293 |
| 16 | Manhattan Construction | $101,143,456 |
| 17 | Messer Construction | $76,391,161 |
| 18 | PCL Construction Enterprises | $72,608,518 |
| 19 | James G. Davis Construction | $44,547,761 |
| 20 | Executive Construction | $37,900,000 |
| 21 | Ryan Companies US | $34,516,012 |
| 22 | Swinerton | $31,553,960 |
| 23 | Big-D Construction | $25,852,269 |
| 24 | McCownGordon Construction | $24,002,000 |
| 25 | Gilbane Building Company | $18,377,000 |
| 26 | EW Howell Construction Group | $15,640,000 |
| 27 | DPR Construction | $13,839,000 |
| 28 | Lendlease | $12,659,891 |
| 29 | Bancroft Construction | $11,768,062 |
| 30 | McDonough Bolyard Peck (MBP) | $10,262,304 |
| 31 | Burns & McDonnell | $8,748,244 |
| 32 | Russell Group | $8,000,000 |
| 33 | Alberici-Flintco | $7,744,678 |
| 34 | Balfour Beatty US | $7,530,825 |
| 35 | Robins & Morton | $5,845,382 |
| 36 | W.E. O'Neil Construction | $4,932,113 |
| 37 | Harkins Builders | $4,810,000 |
| 38 | JLL | $3,734,251 |
| 39 | Walsh Group, The | $2,885,100 |
| 40 | Barton Malow | $2,052,464 |
| 41 | Power Construction | $2,000,000 |
| 42 | Skanska USA | $1,474,261 |
| 43 | W.M. Jordan Company | $1,265,000 |
| 44 | AECOM | $1,000,000 |
| 45 | Saunders Construction | $811,000 |
| 46 | Hoar Construction | $808,000 |
| 47 | Landry/French Construction | $778,218 |
| 48 | PMA Consultants | $703,159 |
| 49 | Henderson Building Solutions | $654,539 |
| 50 | KCI Technologies | $460,000 |
Category : Federal Government Investment in Infrastructure
